







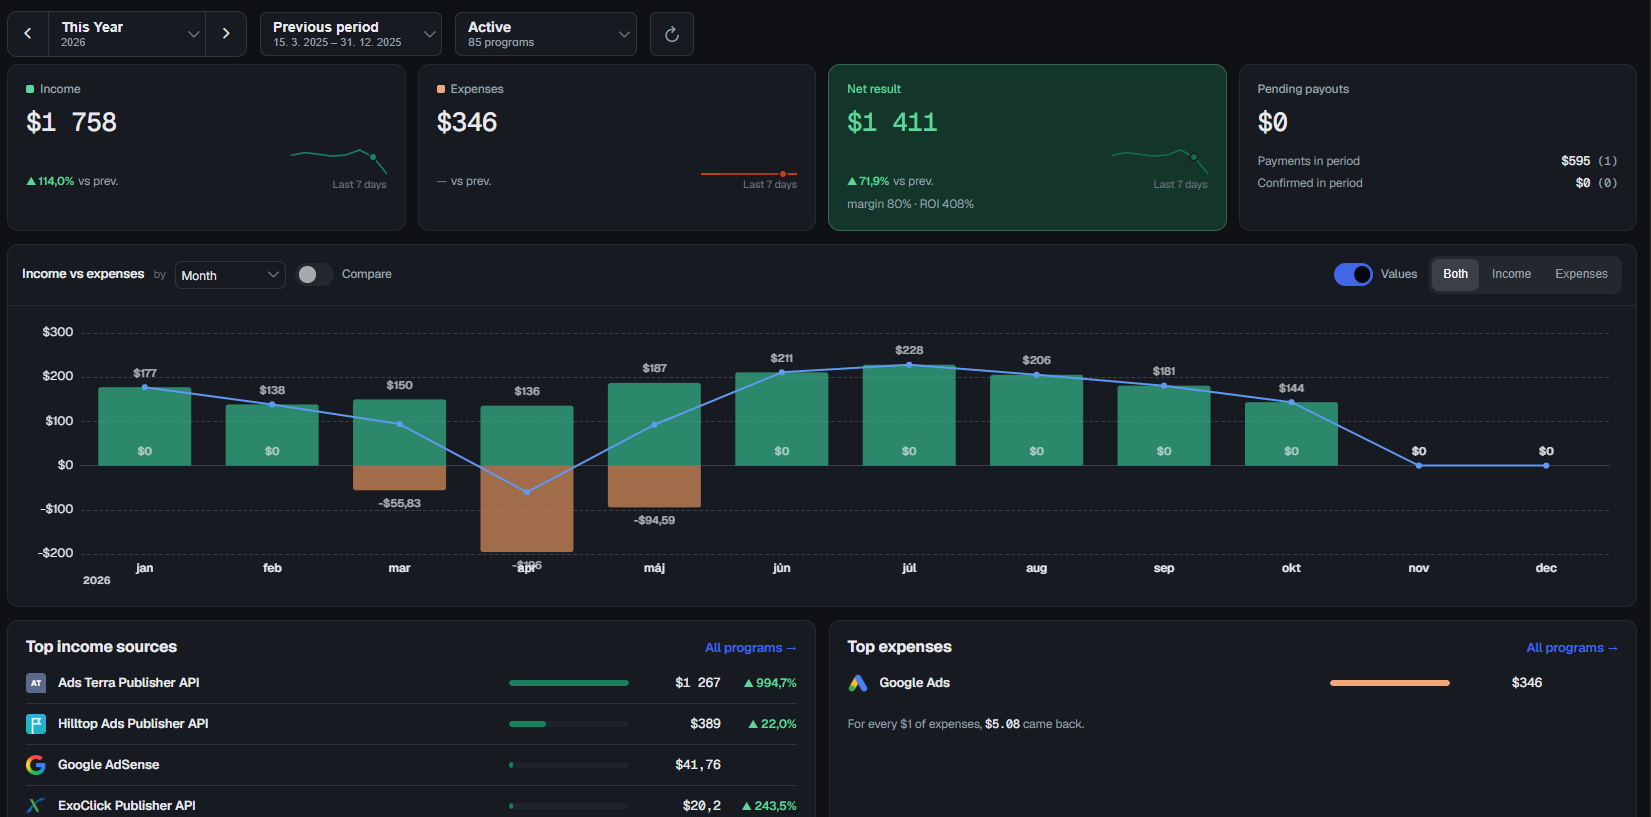
Nifty Stats Cloud just got its biggest update so far — a new dashboard, brand-new income vs expenses charts and dark mode.
What's new:
- Income vs expenses in one chart — income above the line, expenses below it, and a Net result line that shows what you actually kept.
- Period comparison — flip one switch and the previous period is drawn over your current numbers. Group by day, week, month or quarter.
- The numbers that matter, up top — income, expenses, net result, margin and ROI, each compared to the previous period.
- Top income sources & top expenses — see which programs pay best and how much every $1 you spend brings back.
- New design + dark mode — cleaner UI, collapsible menu, and fast even with 80+ programs and years of history.
We're looking for beta testers. If you run multiple affiliate programs and want early access with your own data, plus a direct line to the people building it, contact us and tell us which programs you use.
Using the Windows app? Nothing changes, it keeps working as usual.
Full article with screenshots: https://www.niftystats.com/nifty-stats-cloud-new-dashboard-and-charts/